The web control provides a near-real-time graphical and numerical view of block attribute values over time. Each attribute can be displayed as a chart or a table.
Working with charts
A chart starts recording when you open it by clicking the information icon next to an attribute in its block’s detail panel. Data is “for information only” — it represents the attribute’s behaviour over the time the chart is open.
The web control renders every attribute type as a chart:
| Attribute format | Plot type |
|---|---|
| Numerical | Continuous scatter plot; attribute value on Y axis, time on X axis |
| Text | Discrete scatter plot; each unique text string on Y axis |
| Boolean | On/off state plot on Y axis |
Chart controls
Hover over the chart to reveal the menu bar:

Chart controls toolbar
| Control | Description |
|---|---|
| Download Plot as PNG | Save a snapshot of the current chart |
| Edit in Chart Studio | Export data to the Chart Studio online tool |
| Zoom | Draw a bounding box to zoom; smaller box = higher zoom; updates pause while zoomed |
| Pan | Pan horizontally or vertically; updates continue while panning |
| Zoom in / out | Auto-zoom centred on the most recent data; updates pause while zoomed |
| Autoscale | Scale the plot to show all data since the chart was opened |
| Home (Reset Axes) | Return to the default scale and resume live updates |
| Toggle Spike Lines | Overlay crosshair guide lines on hover |
| Show closest data on hover | Display the value of the nearest data point to the cursor |
| Compare data on hover | Display all attribute values at the time point under the cursor |
Chart update behaviour
Data is supplied at up to 20 Hz.
The on-screen chart updates at 1 Hz; each update plots all 20 Hz samples collected in the preceding second.
Zooming pauses automatic chart updates so you can inspect a snapshot. Automatic updates resume when you return to the default view (Home / Reset Axes).
Exporting a chart
Click Download Plot as PNG in the chart menu bar at any time. The snapshot is saved to your browser’s default downloads folder.
Advanced analysis with Chart Studio
Click Edit in Chart Studio to export the current on-screen data to the Plotly Chart Studio web application. See the Chart Studio documentation for its full feature set.
Working with numerical tables
A table presents attribute values in numerical form. Each row records a value change and shows:
The time of the change
The new attribute value
The attribute alarm status
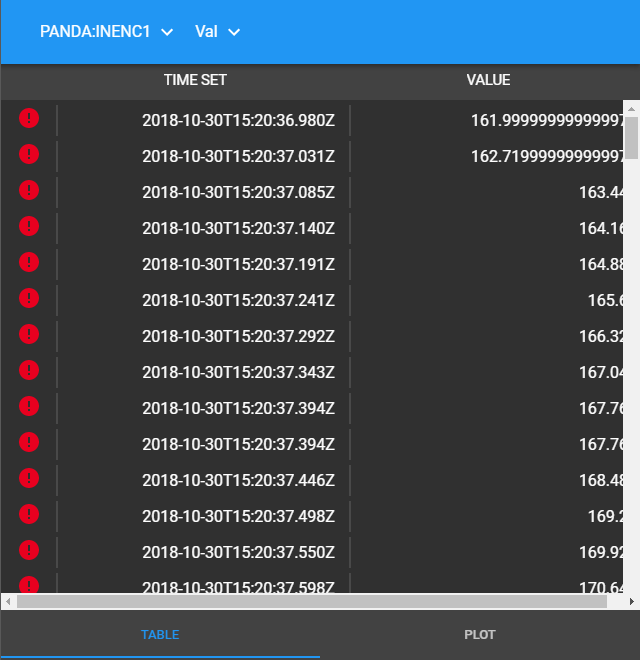
Attribute values presented in a numerical table
The data shown is “for information only” and covers only the time the table has been open.
Table update behaviour
Data is supplied at up to 20 Hz.
The table updates at 1 Hz; each update appends all 20 Hz samples from the preceding second.
New rows are added at the bottom of the table.